The Power of Data in Energy Trading

Welcome to EnergyRogue.com, the go-to source for the latest insights and analysis on the energy commodities market. Led by two industry veterans, Bill Shanahan and Brian Pieri, the weekly commodity market recap dives deep into the world of energy trading. With over 55 years of combined experience, Bill and Brian break down market trends, share their insights, and answer the pressing question: What data is important in energy trading?
Introduction to Energy Rogue
Bill: We have seen it all.
Brian: Have we? I keep thinking we’ve seen it all, but people keep surprising me. But nuke was still confused.
Bill: Exactly. So today, we’ll talk about the power of data in energy trading. Now, what does that mean? What kind of power is that, Brian?
Brian: Well, one question we get a lot is what data is important. We’re surrounded by data. Ten to 20 years ago, getting the data was difficult. Now, it’s about what to do with it and how to interpret it. The power of data in energy trading comes from various key sources, and we’re going to step through a tutorial on what’s important and what data matters.
Key Energy Markets: Crude Oil and Natural Gas
We’re primarily focused on crude oil and natural gas, but we also cover ultra-low sulfur diesel and RBOB (Reformulated Blendstock for Oxygenate Blending).
Bill: The word for RBOB is a mouthful. How do you say it?
Brian: Reformulated blendstock for oxygenate blending. Or just RBOB.
These markets are interconnected, but for simplicity, we’ll focus on crude oil and natural gas. Remember, we’re only scratching the surface of what’s necessary to understand the energy markets.
Why Data is Crucial
The essence of our trading strategy revolves around a comprehensive understanding of the following types of data:
- Physical Markets:
- Where: Identifying key trading points inside the United States like CIG in the Rockies.
- When: Understanding the timeline for transactions in physical and financial markets.
- Financial Markets:
- Exchanges: Multiple exchanges like CME (Chicago Mercantile Exchange) or Nymex (New York Mercantile Exchange) are the platforms for trading commodities.
- Timing: Contracts have different timeframes, important for understanding current and future market conditions.
Tools and Resources
Key Reports and Platforms
- EIA Weekly Petroleum Status Report: Crucial for tracking stocks, production, imports, and refinery inputs in the U.S.
- Federal Reserve Beige Book: Offers narrative insights into economic conditions across the U.S. regions.
- OPEC Monthly Market Report: Provides an extensive look at international supply, demand, and economic conditions.
- CFTC Commitment of Traders Report: Offers insights into market positions of various players.
- Interactive Charts: Available through our Rogue Edge platform, providing easy visualization of market trends.
Understanding Physical and Financial Markets
- Physical Market:
- Example: NYMEX futures price minus 60 cents gives the theoretical value of CIG in the Rockies.
 – Financial Market:
– Exchanges: Primary trading happens on NYMEX in the U.S., but crude oil also trades 24/7 on international exchanges like Hong Kong and London.
The Crude Oil Market
EIA Petroleum Status Report
This weekly report covers stocks (inventories), production, imports, exports, and refinery inputs. For example, a snapshot from the report might show:
- Current stocks: 445 million barrels
- Last week’s stocks: 448 million barrels
- Draw: 3 million barrels
Analyzing Stocks and Changes
- Crude Oil:
- Stocks decreased from 448 to 445 million barrels – indicating a draw.
- SPR (Strategic Petroleum Reserve) dynamics.
Importance of Historical Perspective
Our platform places this data in a historical context to highlight trends over time. For example:
“Our production is at the very top of the five-year average, setting new highs.”
Understanding these trends helps in making informed trading decisions.
International Perspectives: OPEC
The OPEC monthly report is a treasure trove of data, usually between 80-120 pages covering:
- Price movements
- World economy
- World demand and supply
- Product markets and refining operations
Impact of Geopolitical Events
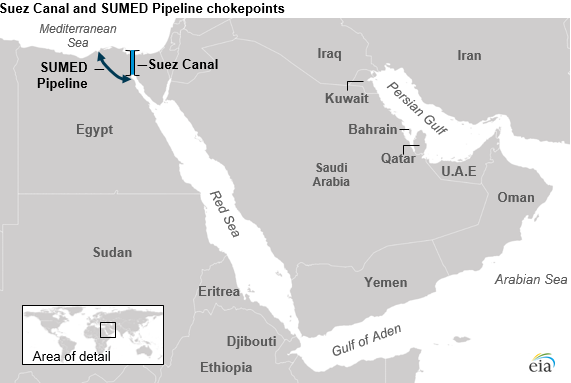
Recent geopolitical changes, such as conflicts in key shipping routes, significantly impact tanker markets and trade dynamics.
 ### Specific Country Insights
- Iran: Despite sanctions, Iran’s production has nearly recovered to pre-sanction levels (3.2 million barrels/day from a max of 3.8 million).
Natural Gas Markets
Key U.S. Reports
- EIA Natural Gas Weekly Update
- EIA Weekly Storage Report
Analyzing Supply and Demand
- Supply: Currently at 109.8 bcf/day, including Canadian imports.
- Demand: Power, industrial, LNG exports, Mexican exports.
Here’s a snapshot of our data trends:
 > “Since 2019, we’ve seen higher highs and higher lows in electricity consumption, indicating growing demand.”
Export Dynamics
- Mexico Exports: Growing from 4.5 bcf/day in 2018 to 6.6-7 bcf/day.
- LNG Exports: Substantial increase from 2018, now a significant part of U.S. demand.
Using Data to Forecast Trends
Example Analysis
- Permian Basin: Vital to track production and decline rates to forecast future supply.
“Currently, the Permian declines by 424,000 barrels/day every month. So, to grow by 10,000 barrels, we need 435,000 barrels of new production.”
Our platform helps visualize these intricate relationships, turning data into strategic insights.
Final Thoughts
Bill: Evaluating the energy complex is not as difficult as it seems. With the right data, you can do this.
Brian: Headlines can often be misleading. Making decisions based on detailed, accurate data is crucial.
We encourage businesses that depend on energy markets to dive deep into reports like the EIA Petroleum Status Update, OPEC Monthly Report, and the Fed Beige Book. It’s not just about what data you have, but what you do with it.
Join Us
For those looking to take control of their energy market strategies, join us at Energy Rogue. With our platform, you’ll access interactive charts, expert insights, and a supportive community.
Bill: Remember, taking action based on accurate data can significantly improve your business outcomes.
Brian: Thanks for tuning in. We’ll see you next Wednesday. Don’t get confused – join us and take control!
Bill: See you, folks.